
Nifty Index Investing Newsletter [17th Feb 2024]
What to do in current market scenario ? SIP or Lump sum ?

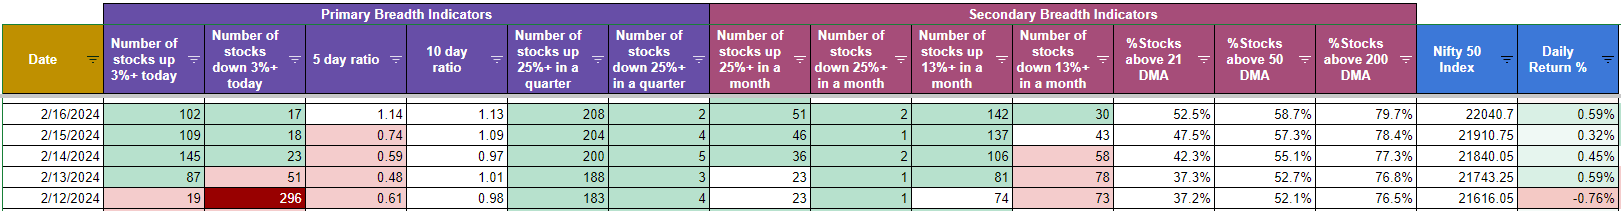
The week started with the expected redness of “love in the air” and gave everyone the chills as market breadth took quite a hit and one can notice that by seeing %stocks below 200 DMA reducing to 76% from 80% on Friday (9th Feb). This small fall lasted only Monday, then its was back on track and Nifty reclaimed 22k level along with 21 DMA.
[Please note, we only track 750 stock universe comprising of NIFTY500 and NIFTYMicroCap250 indexes]
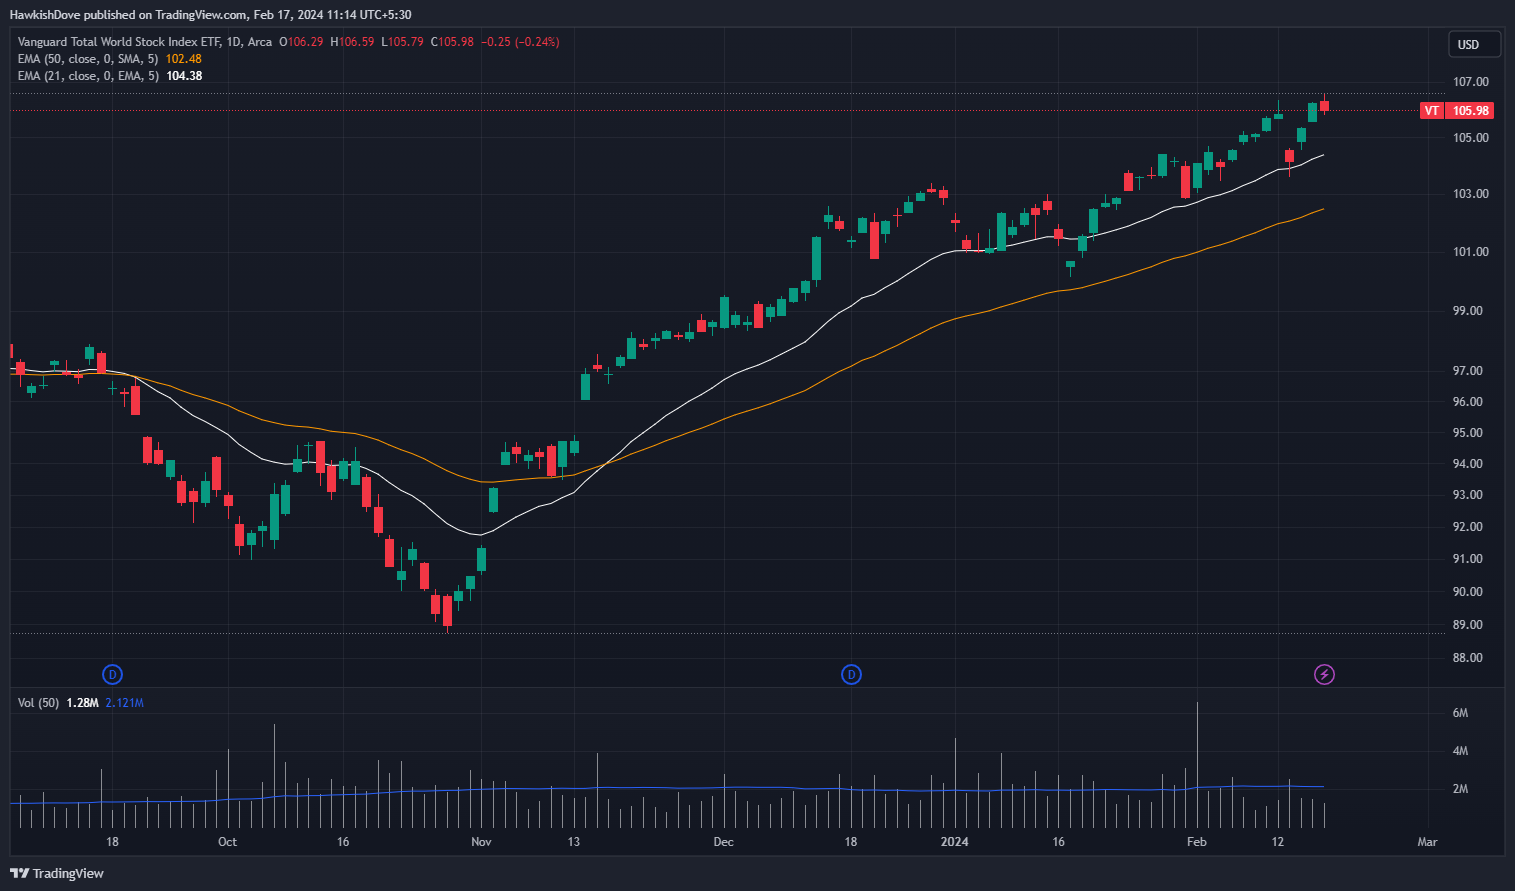
World markets as well are on the upwards trajectory in momentum so Nifty for now is following that trend. The Vanguard total world stock index ETF, took support at 21 DMA this week and bounced back strongly indicating some continuation of momentum which may stick in the next week.
But as you know, we are not here to predict what happens, we are here to understand if its time to press on the gas for lumpsum investments or just do our normal SIPs ;)
Let’s get to the meat of this week’s update and see how the Nifty Market Breadth Tables are looking now. If you remember I shared the table last week and mentioned that I’ll be sticking with the planned SIP for now. Following are the links in case you missed the previous updates :
30th Dec 2023
06th Jan 2024
13th Jan 2024
20th Jan 2024
26th Jan 2024
03rd Feb 2024
10th Feb 2024
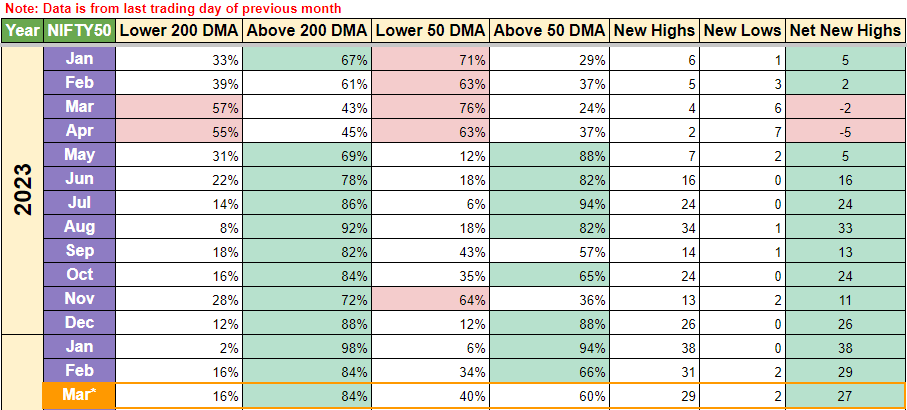
Nifty50 is pretty much as the same place when comparing week over week, in terms of percentages for 50 and 200 DMA.
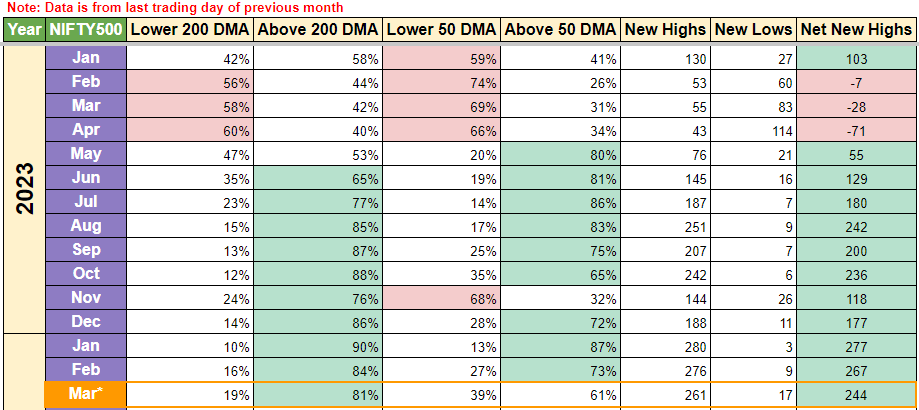
For Nifty500, a few stocks slipped below 50 DMA, but overall breadth has stayed strong, with one point to be highlighted : Net new highs. Consider this metric as number of stocks making new highs - number of stocks making new lows. The higher the number, the higher the market is riding on optimism.
Week over week, this number has reduced from 268 to 244. So even though the %s might not be giving us an indication, Net new highs is telling us that despite Nifty50 staying strong, Nifty 500 has dissipated some heat in the past week.
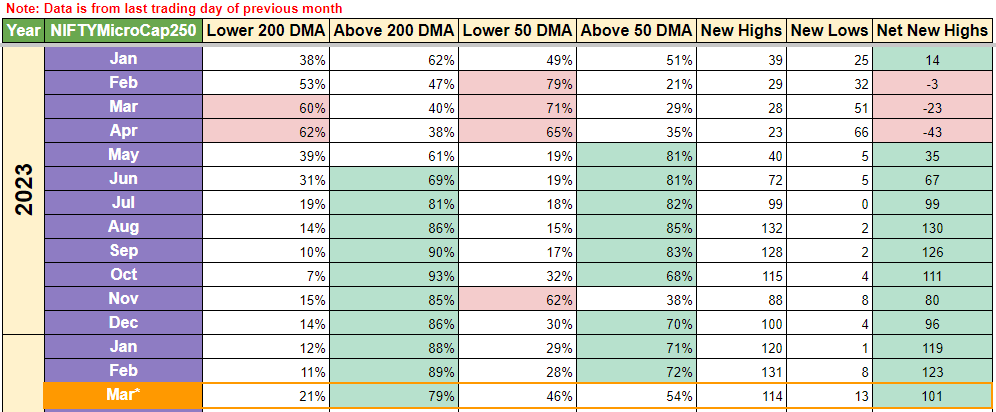
For MicroCap250, the story was rocky, I remember seeing this grid with red in the row post monday close, but now the grid is acting like all’s good, nothing ever happened. Here the story is same as Nifty500, Net new highs week over week have reduced from 112 to 101 which %s not changing much.
Maybe its a sign of things to come, maybe not. All we can do it read the table week over week and press on that beautiful app on our smartphones to buy more units for our passive investments ;)
[Give it time, these numbers will become second nature once you keep looking at it every week]
In case you are confused about what the column headers in the table mean, following definitions should help you out (also shared in the previous newsletter):
200 DMA → 200 Day Moving Average
Above → % of Stocks in Nifty 500 Index above its 200 DMA price
Lower → % of Stocks in Nifty 500 Index lower its 200 DMA price
50 DMA → 50 Day Moving Average
Above → % of Stocks in Nifty 500 Index above its 50 DMA price
Lower → % of Stocks in Nifty 500 Index lower its 50 DMA price
New Highs → # of stocks making New 52 Week Highs (previous rolling month)
New Lows → # of stocks making New 52 Week Lows (previous rolling month)
Net New Highs → New Highs - New Lows (previous rolling month)
So, my fundamental rule here is “red cell in the row” be aggressive and buy lumpsum ELSE keep the monthly SIP rolling as per plan…
Based on the above rule, I’ll be keeping the SIP train on track and DO THE MONTHLY SIP for this particular month.
As always, I’ll be sharing weekly updates with the above tables and it will slowly become apparent when can one be aggressive or when can one continue with SIPs. As long as data gives comfort to invest big, that’s all we need it for. Removing emotion from SIPs is the best thing a passive investor can do. And investing big lumpsum amounts when the time comes will be like a rocket fuel to overall corpus.
For reference, in 2023, One could have been aggressive with lumpsum investments in Jan-Feb-Mar-Apr-Nov as per data in the above tables. This would have resulted in better returns when we consider investing in the Indexes (whether it be Nifty50, Nifty500 or Nifty MicroCap250).
Intention here is to average out fund units when turbulence hits. This way we lower our average purchase price more aggressively than when done with SIPs.
Please note, this strategy is usable only when one believes the India story and want to be part of India’s growth. If India has to grow and become a bigger economy, then Indexes like Nifty50, Nifty500 & NiftyMicroCap250 have to go much higher from here.
Covering Top 750 stocks (Nifty 500 and NiftyMicroCap250) is more than enough for the passive investor, going beyond that becomes too risky as liquidity is not supportive much.
Have a great week ahead and Happy Investing :)
[Disclaimer: The information in this article is for informational purposes only and is not financial advice. The author is not a licensed financial advisor. Readers should conduct their own research and consult with a qualified professional before making any financial decisions.]